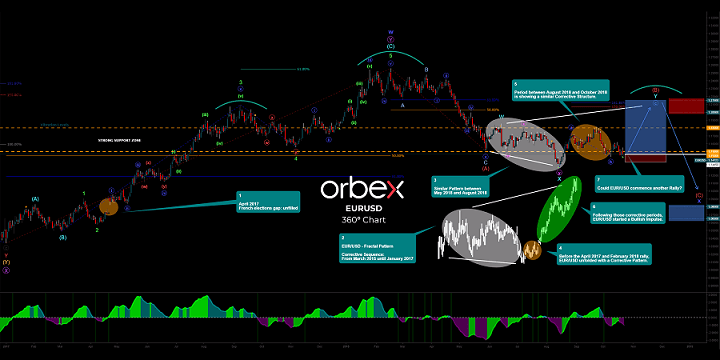
EUR/USD Daily – 360° Infographic Chart
The Infographic Chart below has been optimized for a 360° view.
As far as I’m concern, this is a premiere, the 360° Info-Chart.
This is my attempt to do something different, something that would look cool, while in the same time delivering the valuable message.
It will be interesting to see see how this Infographic Chart would be digested by viewers and the reactions.
Please share if you like it, thanks!
Comments are welcome.
EUR/USD Daily – 360° Infographic Chart
- April 2017 – French elections gap: unfilled
- EUR/USD Fractal Pattern: Corrective Sequence from March 2015 until January 2017
- Similar Corrective Pattern between May 2018 and August 2018
- Before the April 2017 and February 2018 rally, EUR/USD unfolded with a Corrective Pattern
- Period between August 2018 and October 2018 is showing a similar Corrective Structure
- Following those corrective periods, EUR/USD started a Bullish Impulse
- Could EUR/USD commence another Rally?

